Figure 1. Sample flow waveform for subject during 7-syllable /pa/ task.
Significance of analysis window size in maximum flow declination rate (MFDR)
Linda M. Carroll, PhD
Department of Otolaryngology, Mount Sinai School of Medicine
Goal:
Background:
Examination of laryngeal aerodynamics remains crucial to our understanding of voice function in normal and non-normal subjects. Extensive research over the past 40 years has focused on subglottal pressure and transglottal flow, particularly as it relates to frequency and intensity control. More recently, the speed of closure at the maximal negative slope of the differentiated inverse-filtered waveform, or maximum flow declination rate (MFDR), has emerged as a valuable measure of laryngeal function (1-8). Although subglottal pressure and transglottal flow have established measurement techniques for data extraction methods (e.g.: peak pressure value during [p] for subglottal pressure), such standards do not exist for MFDR. As such, it becomes difficult to compare results across studies which have used a wide range of measurement techniques.
Assumptions
Experimental Design:
Subjects:
| Group | A (international level singers) N=4 |
B (regional/national level singers) N=4 |
| Age | 34.5 years | 36 years |
| Professional experience | 8.25 yrs | 8 yrs |
| Years Training | 16.7 yrs | 13.7 yrs |
Tasks:

Figure 1. Sample flow waveform for subject during 7-syllable /pa/ task.
Data Collection:
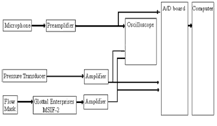
The subject held a pneumotachograph mask firmly in place over her nose and mouth, with a pressure tube passing between the lips. A microphone was fitted in the mask handle.

Figure 2. Block diagram of experimental instrumentation.
Data Analysis:


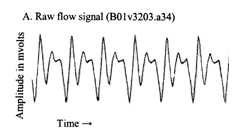
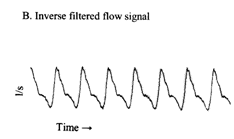
Figure 3. Sample flow signal (A) and inverse filter of signal (B).


Figure 4. Sample of Inverse-filtered flow signal with differentiated waveform
for MFDR for one subject. Tracings show easy marking of MFDR point for upper
trace, and need for hand-marking of MFDR point in lower trace with change in
cursor position within /pa/ from 256 ms into /pa/ (upper trace) to 321.7 ms
into /pa/ (lower trace).
Subject performance was compared from 4 different extraction windows within each /pa/ for the 7-syllable train at F01 and F02.
Statistical Analysis
SPSS?®, with overall![]() =0.05
, with each /pa/ studied as unique variables. Each subject’s mean MFDR
(and sd-MFDR) was a composite of three trial tokens at each pitch condition.
=0.05
, with each /pa/ studied as unique variables. Each subject’s mean MFDR
(and sd-MFDR) was a composite of three trial tokens at each pitch condition.
Results:
Table 1. MFDR means (and standard deviations) and maximum MFDR for F01 (pitch=1) for four different data extractions
| Group | Peak Value |
M1 (in l/s |
M2 (in l/s |
M3 (in l/s |
M4 (in l/s |
|
Pa1 |
A B |
488 264 |
79 (25.71) 75 (29.64) |
83 (10.33) 83 (11.23) |
105 (18.51) 113 (16.72) |
120 (13.67) 118 (15.91) |
Pa2 |
A B |
547 166 |
122 (30.56) 67 (19.16) |
129 (13.31) 74 (7.17) |
155 (14.46) 91 (9.81) |
158 (14.1) 93 (9.06) |
Pa3 |
A B |
313 283 |
145 (22.97) 97 (23.63) |
150 (17.76) 108 (10.18) |
154 (19.36) 125 (11.26) |
173 (16.44) 128 (12.56) |
Pa4 |
A B |
430 264 |
157 (21.48) 114 (22.14) |
159 (17.52) 121 (10.66) |
175 (19.88) 133 (11.4) |
181 (21.07) 135 (11.44) |
Pa5 |
A B |
254 596 |
124 (18.97) 109 (30.23) |
132 (11.24) 129 (12.58) |
143 (13.49) 147 (17.22) |
146 (12.29) 151 (16.54) |
Pa6 |
A B |
195 127 |
67 (11.49) 52 (19.23) |
74 (6.75) 54 (7.8) |
79 (7.22) 76 (7.98) |
81 (6.78) 79 (7.49) |
Pa7 |
A B |
88 195 |
36 (8.2) 27 (10.61) |
37 (4.75) 31 (6.68) |
43 (5.22) 41 (7.9) |
44 (4.8) 43 (7.78) |
Table 2. MFDR means (and standard deviations) and maximum MFDR for F02 (pitch=2) for four different data extractions
| Group | Peak Value |
M1 (in l/s |
M2 (in l/s |
M3 (in l/s |
M4 (in l/s |
|
Pa1 |
A B |
1436 264 |
167 (114.74) 48 (49.38) |
210 (94.82) 50 (20.03) |
315 (121.77) 85 (32.8) |
422 (50.86) 116 (9.79) |
Pa2 |
A B |
908 352 |
178 (120.43) 44 (30.82) |
242 (91.88) 50 (23.53) |
310 (115.32) 85 (36.67) |
396 (50.39) 122 (12.84) |
Pa3 |
A B |
1221 986 |
233 (116.1) 91 (65.81) |
250 (95.3) 105 (46.47) |
345 (109.87) 170 (77.86) |
442 (52.73) 240 (39.13) |
Pa4 |
A B |
1084 811 |
238 (130.74) 112 (72.39) |
264 (126.2) 154 (57.64) |
320 (124.77) 199 (75.34) |
445 (51.48) 274 (38.93) |
Pa5 |
A B |
1191 908 |
201 (119.57) 87 (50.12) |
266 (111.25) 108 (39.65) |
344 (92.44) 152 (52.89) |
415 (42.52) 204 (28.76) |
Pa6 |
A B |
430 352 |
78 (40.63) 47 (30.86) |
92 (40.41) 54 (18.67) |
118 (45.71) 79 (28.94) |
160 (13.49) 109 (11.51) |
Pa7 |
A B |
264 186 |
45 (23.65) 28 (13.69) |
47 (20.97) 35 (11.32) |
66 (25.98) 43 (13.05) |
89 (11.05) 56 (7.37) |
Table 3. Main effect and interaction effects of pitch condition (frequency
F01, F02), window size (method 1, 2, 3, 4) and group (A, B) on mean MFDR and
sd-
MFDR for each individual /pa/ during the 7-syllable train.*
| Source | F | Sig. |
Source | F | Sig. |
||
| Pa1 | Pitch Window Group Pitch x window Pitch x group Window x group |
0.507 5.212 0.782 0.638 22.006 0.005 |
ns 0.004** ns ns 0.000*** ns |
sdPa1 | Pitch Window Group Pitch x window Pitch x group Window x group |
14.875 4.479 0.960 1.370 16.192 0.194 |
0.000*** 0.008** ns ns 0.000*** ns |
| vPa2 | Pitch Window Group Pitch x window Pitch x group Window x group |
0.667 7.607 4.449 1.725 20.071 0.031 |
ns 0.000*** 0.079† ns 0.000*** ns |
sdPa2 | Pitch Window Group Pitch x window Pitch x group Window x group |
70.859 7.915 4.350 2.610 15.129 0.149 |
0.000*** 0.000*** 0.082† 0.064† 0.000*** ns |
| Pa3 | Pitch Window Group Pitch x window Pitch x group Window x group |
18.287 7.123 2.204 2.748 11.566 0.174 |
0.000*** 0.001*** ns 0.055† 0.001*** ns |
sdPa3 | Pitch Window Group Pitch x window Pitch x group Window x group |
166.142 5.139 2.288 3.054 5.941 0.488 |
0.000*** 0.004** ns 0.039* 0.019* ns |
| Pa4 | Pitch Window Group Pitch x window Pitch x group Window x group |
33.673 6.407 1.514 3.868 6.326 0.168 |
0.000*** 0.001*** ns 0.016* 0.016* ns |
sdPa4 | Pitch Window Group Pitch x window Pitch x group Window x group |
82.902 3.468 1.789 3.054 7.646 0.564 |
0.000*** 0.024* ns 0.039* 0.008** ns |
| Pa5 | Pitch Window Group Pitch x window Pitch x group Window x group |
8.496 10.896 1.836 3.080 65.663 0.254 |
0.006** 0.000*** ns 0.038* 0.000*** ns |
sdPa5 | Pitch Window Group Pitch x window Pitch x group Window x group |
242.386 12.910 0.947 5.054 57.965 1.245 |
0.000*** 0.000*** ns 0.004** 0.000*** ns |
| Pa6 | Pitch Window Group Pitch x window Pitch x group Window x group |
0.382 6.612 0.771 1.321 7.631 0.156 |
ns 0.001*** ns ns 0.008** ns |
sdPa6 | Pitch Window Group Pitch x window Pitch x group Window x group |
42.081 6.594 0.552 2.206 13.064 0.595 |
0.000*** 0.001*** ns ns 0.001*** ns |
| Pa7 | Pitch Window Group Pitch x window Pitch x group Window x group |
0.154 2.702 0.768 0.271 1.123 0.030 |
ns 0.058† ns ns ns ns |
sdPa7 | Pitch Window Group Pitch x window Pitch x group Window x group |
10.222 1.792 0.314 0.568 7.678 0.349 |
0.003** ns ns ns 0.008** ns |
Table 4. Mean MFDR and sd-MFDR pairwise comparisons of window sizes (where W1=method 1; W2=method 2; W3=method 3; W4=method 4) for individual /pa/ during 7-syllable train.
| Pairwise Comparison | Mean difference | Sig. | Pairwise Comparison | Mean difference | Sig. | ||
| Pa1 | W1 x W2 W1 x W3 W2 x W3 W3 x W4 |
-0.068 -0.446 -0.377 -0.191 |
ns 0.023† ns ns |
sdPa1 | W1 x W2 W1 x W3 W2 x W3 W3 x W4 |
-.0.673 0.223 -0.450 0.586 |
U |
| vPa2 | W1 x W2 W1 x W3 W2 x W3 W3 x W4 |
-0.114 -0.452 -0.339 -0.160 |
ns 0.004* ns ns |
sdPa2 | W1 x W2 W1 x W3 W2 x W3 W3 x W4 |
0.609 0.308 -0.301 0.468 |
0.001* ns ns 0.009* |
| Pa3 | W1 x W2 W1 x W3 W2 x W3 W3 x W4 |
-0.113 -0.263 -0.150 -0.188 |
ns 0.015† ns ns |
sdPa3 | W1 x W2 W1 x W3 W2 x W3 W3 x W4 |
0.294 0.153 -0.141 0.425 |
ns ns ns 0.008* |
| Pa4 | W1 x W2 W1 x W3 W2 x W3 W3 x W4 |
-19.448 -51.394 -31.946 -52.310 |
ns ns ns ns |
sdPa4 | W1 x W2 W1 x W3 W2 x W3 W3 x W4 |
8.685 3.839 -4.846 27.117 |
ns ns ns 0.014† |
| Pa5 | W1 x W2 W1 x W3 W2 x W3 W3 x W4 |
-0.167 -0.352 -0.184 -0.146 |
ns 0.000* ns ns |
sdPa5 | W1 x W2 W1 x W3 W2 x W3 W3 x W4 |
0.392 0.245 -0.147 0.386 |
0.001* 0.023† ns 0.001* |
| Pa6 | W1 x W2 W1 x W3 W2 x W3 W3 x W4 |
-0.086 -0.362 -0.276 -0.168 |
ns 0.010* ns ns |
sdPa6 | W1 x W2 W1 x W3 W2 x W3 W3 x W4 |
0.507 0.271 -0.237 0.519 |
0.009* ns ns 0.008* |
| Pa7 | W1 x W2 W1 x W3 W2 x W3 W3 x W4 |
-0.075 -0.330 -0.255 -0.149 |
ns ns ns ns |
sdPa7 | W1 x W2 W1 x W3 W2 x W3 W3 x W4 |
0.447 0.086 -0.362 0.316 |
ns ns ns ns |
*Note: Comparisons significant at an overall ![]() level of 0.05 are indicated by *. Marginal significance is indicated by †.
level of 0.05 are indicated by *. Marginal significance is indicated by †.
Discussion:
There does not appear to be a significant difference in overall data from a 1000 ms analysis window to a smaller 100 ms analysis window. However, the location of the 100 ms segment does appear to alter the mean MFDR value. A greater mean MFDR was found when centered on the peak MFDR for the utterance. MFDR was found to be significantly greater at the higher fundamental frequency during the middle of a messa di voce task in the peak window analysis segment (method 3) and higher among elite singers (group A).
There is no difference in MFDR data from a 100 ms analysis segment vs. a 20 cycle analysis segment for medium low pitch (F01=330 Hz) or medium high pitch (F02=660 Hz) among professional female singers.
It is suggested that window extraction specifics be included in future research to allow closer comparison of mean MFDR.
Summary:
A moderate sized window segment appears to be sufficient for determining mean MFDR. There does not appear to be a significant advantage to using a large (1000 ms) analysis window.
Among the professional singer population, there does appear to be a difference at the glottal level in management of airflow shut-off when fundamental frequency increases among subjects who are employed in regional/national level opera companies vs. those employed at international level opera companies.
Both groups were found to increase MFDR as fundamental frequency increased.
References: